Emxsys

Emergency Management Expert Systems

for Wildland Firefighting

Follow Emxsys on Twitter

Documentation

The CPS software can be downloaded from the Software page.

Check out the CPS Wiki for more information about the software development.

Campbell Prediction System (CPS)

Overview

The following is an overview of the CPS v1.0 software.  This version contains the following features:

  • 3D Map & Terrain Viewer for selecting and viewing a point of interest on the fireground
  • Complete Fuel Model Selection: 40 Standard (static and dynamic) and the original 13 -- complete with help guides
  • Fully interactive: All fire environmental inputs are dynamically coupled to fire behavior outputs. For example, any change in location in the map viewer will change the fire behavior according to the new location's slope and aspect.
  • Screen layout can be setup to demonstrate the alignment of forces concept taught in the Campbell Prediction System training.


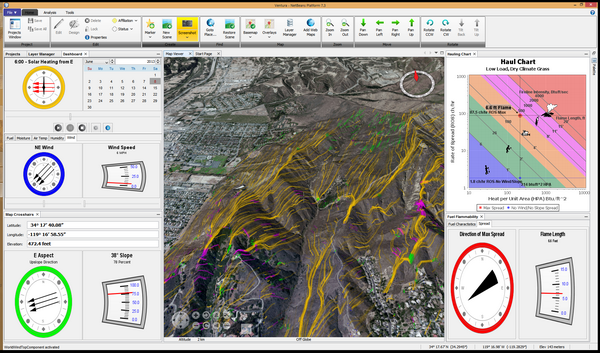
Figure 1. Example demonstrating the "alignment of forces" concept.

Figure 1 shows an overview of the CPS software.  On the left are a series of panels used for controlling and depicting the fire behavior inputs.  In the center is a map and terrain viewer.  On the right are the fire behavior outputs.

Map / Terrain Viewer

The Map Viewer is a 3D tool for selecting and viewing the location used for fire behavior calculations. Terrain can be viewed from any perspective and on a variety of maps. The location of crosshairs at the center of the map viewer are used to obtain the terrain's slope and aspect, as well as defining the latitude used to determine solar preheating of the fuel.

Map Viewer


Figure 2. Map Viewer Crosshairs

The Map Viewer contains a set of crosshairs at the center of the viewer.  The location of these crosshairs are used for determining the slope and aspect within the fire behavior calculations.  Any change in the crosshairs location will be reflected immediately in the Map Location and the Fire Behavior panels.

Map Viewer Controls

Several buttons are displayed in the lower-left corner of the viewer which are used for controlling the view angles, panning and zooming.

Mouse and Keyboard Actions

The following table describes the mouse and keyboard actions that control the view angles, panning and zooming.  Note the different mouse actions for the PC and Mac.

Mouse Controls Keyboard Controls
Pan Navigation - Move the Crosshairs

Click on the map to place the crosshairs in the location of the click.

Left Drag-Click to scroll the terrain to the desired location.

Use the [Left/Right] and [Up/Down] arrow keys to move the crosshairs.

Use [ALT]+[Left/Right] and
[ALT]+[Up/Down]
to move slowly.

Zoom In / Out

PC: Use the Mouse Wheel .

MAC: Use the two-finger up/down gesture on the mouse pad.

Use the [+] and [-] keys to zoom in and out respectively.

Use [ALT]+[+/-] to zoom slowly.

Rotate the View

PC: Use a  Right Drag-Click in the left/right directions.

MAC: Use the two-finger left/right gesture on the mouse pad.

Use the [Shift]+[Left/Right] keys to rotate the view around the crosshairs.

Use the [N] key to return to a North Up orientation.

Tilt the View

PC: Use the Right Drag-Click in the up/down directions to tilt the view.

MAC:

Use the [Shift]+[Up/Down] arrow keys to tilt the view.

Use the [R] key to return to a Look Down orientation.


Map Crosshairs

The Map Location panel shows the location of the crosshairs within the map viewer.


Figure 3.  Map Crosshairs panel showing location of crosshairs.

Note that the accuracy of the slope and aspect increases as you zoom in on the terrain.

Map Layers

The Map Layers panel allows control of the maps, imagery, and  controls and annotations displayed in the map viewer.


Figure 4. Map Layers panel.

The Map Layers panel controls the layers to be displayed in the Map Viewer.  Each layer may contains sub-layers. Check the layer and sub-layers you want to be displayed on the map.

Alignment of Forces

As one of the fundamental principles of the CPS method, firefighters should recognize how the three primary forces of wind, slope and preheat control fire behavior.  When these three forces are in alignment, then fire behavior is at its worst.

The CPS Dashboard displays the three primary forces concurrently and shows their alignment.

Dashboard


Figure 5. Dashboard with controls arrayed to show "Alignment of Forces".

Figure 5 shows the CPS Dashboard configured to show the direction and strength for each of three primary forces.  Fire behavior is worst when the directional arrows are all pointing in a similar direction.

Fire Environment

Several control panels are used to describe the fire's environment.  These controls are all dynamically coupled to the fire behavior outputs.  Any change to the environment will be reflected immediately in the fire behavior display panels.

Solar Preheating by Date and Time


Figure 6.  Solar Heating and Date and Time controls.

Solar preheating is controlled by date, time and location.  This panel allows you to input the date and time.  Note that the location is controlled by the map viewer.

The direction of the solar rays is shown within the yellow compass rose.

Fuel Models


Figure 7.  Fuel tab showing the selected fuel model with a fuel load graph

The Fuel tab contains a control for selecting a fuel model.  A graph of the fuel load is shown for the selected model.  Clicking the [?] icon will display a help guide with photos to assist you in selecting the appropriate fuel model.

Fuel Moisture Scenarios


Figure 8. Moisture tab showing a selected fuel moisture scenario 

The Moisture tab allows you to select the initial fuel moistures used in the fire behavior calculations.  Note that the 1-hour dead fuel moisture level will be adjusted according to hourly air temperature, humidity and solar heating.

Yesterday's and Today's Air Temperature


Figure 9. Air Temp tab showing air temperature cycle and editable table.

The Air Temp tab allows you to establish the yesterday's actual temperatures and today's forecasted temperatures.  The table is used to set the parameters for the hourly temperature curves displayed in the chart.

These values affect the dead 1 hour and cured herbaceous fuel moistures.

Yesterday's and Today's Humidity


Figure 10. Humidity tab showing relative humidity cycle and editable table.

The Humidity tab allows you to establish the yesterday's actual relative humidity and today's forecasted relative humidity.  The table is editable and is used to set the parameters for the hourly humidity curves displayed in the chart.

These values affect the dead 1-hour and cured herbaceous fuel moistures.

General Winds


Figure 11.  Wind tab showing general wind speed and direction with slider controls

The sliders in the Wind tab allows you control the general wind direction and speed used throughout the fire behavior calculations.

When experimenting with the effects of wind, you may note that the wind speed also has a cooling effect on the fuel.

Map Location


Figure 12. Map Crosshairs panel showing current location and terrain. 

The Map Location panel shows the location of the map viewer's crosshairs.  This location affects the terrain and aspect, the sunrise and sunset times, and solar preheating.

Fire Behavior

The Fire Behavior panels display various outputs from the BEHAVE fire spread equations. All of the fire behavior panels are dynamic.  That is, any change in time, location, wind, fuel model, moisture, air temperature or humidity will be reflected immediately in the following panels.

Direction of Max Fire Spread


Figure 13. Fire Spread tab

This dynamic panel shows the direction of maximum spread and the flame length.  Wind is often a dominating force, but note that when the wind speed is low,  the terrain's aspect and slope excert a greater influence.

Experiment with various wind directions and speeds on different terrain aspects and slopes to better understand this relationship.

Fuel Flammability


Figure 14. Fuel Characteristics tab showing fuel versus air temperatures

This dynamic panel shows the computed fuel temperature and air temperature at the current location. This chart reflects the solar preheating of fuel and responds to changes in location.

A precept of the Campbell Prediction System method is that firefighters should recognize when fuel is, or will be, at its peak temperature. Experiment with changes in the terrain aspect to see when the hours of peak fuel temperature occur.

Haul Chart


Figure 15. Haul Chart

The Haul Chart is a recognizable fire behavior diagram in wildland firefighting. The Haul Chart was so named because it infers the relative intensity of the fire behavior through graphical representations of firefighters working (haul firefighters), equipment working (haul equipment), trees torching (haul retardant), and crown fire (haul everybody to safety). Since fireline intensity and flame length are directly proportional (Byram, 1959), the larger one gets the larger the other gets. And since we can visually assess the flame length, the Haul Chart is an excellent tool for measuring the safety and effectiveness of various fireline resources.

The fireline interpretations of the Haul Chart are as follows: Figure 15. Haul Chart Interpretations (from Fireline Handbook, Appendix B.)

FLAME LENGTH (Feet) FIRELINE INTENSITY (BTU/Ft/Sec INTERPRETATIONS
0-4 0-100 Persons using handtools can generally attack fires at the head or flanks. Handline should hold the fire.
4-8 100-500 Fires are too intense for direct attack on the head by persons using handtools. Handline can not be relied on to hold fire. Equipment such as dozers, engines, and retardant aircraft can be effective.
8-11 500-1,000 Fires may present serious control problems such as torching, crowning, and spotting. Control efforts at the head of the fire will probably be ineffective.
11+ 1000+ Crowning, spotting, and major runs are common, control efforts at the head of the fire are ineffective.

ADJECTIVE RATING FLAME LENGTH IMPLICATION
LOW 0-1 Fire will burn and will spread however it presents very little resistance to control and direct attack with firefighters is possible
MODERATE 1-3 Fire spreads rapidly presenting moderate resistance to control but can be countered with direct attack by firefighters
ACTIVE 3-7 Fire spreads very rapidly presenting substantial resistance to control. Direct attack with firefighters must be supplemented with equipment and/or air support.
VERY ACTIVE 7-15 Fire spreads very rapidly presenting extreme resistance to control. Indirect attack may be effective. Safety of firefighters in the area becomes a concern.
EXTREME >15 Fire spreads very rapidly presenting extreme resistance to control. Any form of attack will probably not be effective. Safety of firefighters in the area is of critical concern.

Fuel Model Guides

Selecting the appropriate fuel model is an important aspect for computing fire behavior. Portions of the GTR-INT-122 - Aids to Determining Fuel Models For Estimating Fire Behavior and RMRS GTR-153 - Standard Fire Behavior Fuel Models have been included to assist in this task.


Figure 16. Fuel Model help.

A guides for fuel models can be found in the help system.  Also, help for a specific fuel model can be obtained from the help button on the Fuel Tab.

Auto Update

The CPS software supports an auto-update feature.  This feature ensures you have the latest software modules and plugins installed.  The updates are delivered via the Web.


Figure 17. Auto-update screen.

The auto-update feature can be accessed via the Check for Updates item in menu system

References

Albini, 1976, GTR-INT-030: Estimating Wildfire Behavior and Effects

Anderson, 1982, GTR-INT-122  - Aids to Determining Fuel Models For Estimating Fire Behavior - 13 Fuel Models

Campbell, 1991, The Campbell Prediction System.

Campbell and Schubert, 2009, A Working Paper: The Art of Wildland Firefighting

Byram and Jemison, 1943, Journal of Agricultural Research: Solar Radiation and Forest Fuel Moisture

Rothermel et al, 1986, RP-INT-359: Modeling moisture content of fine dead wildland fuels: Input to the BEHAVE fire prediction system

Rothermel, 1972, RP-INT-115: A mathematical model for predicting fire spread in wildland fuels

Scott and Burgan, 2005, RMRS GTR-153 - Standard Fire Behavior Fuel Models

Stubbs, 2005, Adjectives Ratings for Fire Behavior

Get Emergency Management Expert System at SourceForge.net. Fast, secure and Free Open Source software downloads